Modeling Information Object Graphics
Applies to: viflow (subscription | 9 | 8) | Article: 1588917 | Updated on 30.04.2024
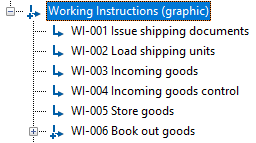
An information graphic represents the assignment of information to one another and can be used, for example, to display folders or folders that consist of several pieces of information.
Modeling an Information Object Graphic
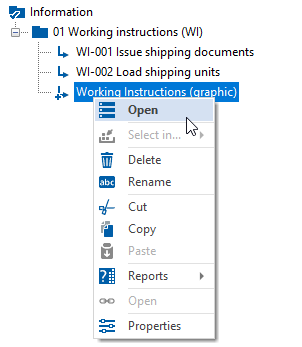
- Right-click the information object to be modeled as a graphic and choose Open from the context menu [
.png) ].
]. You can either click on the information in a window (e.g. information, information structure, overview) or directly in a process graphic.
 - Now add the associated information by proceeding as described in the modeling of process graphics and in the chapter ››› Modeling information.
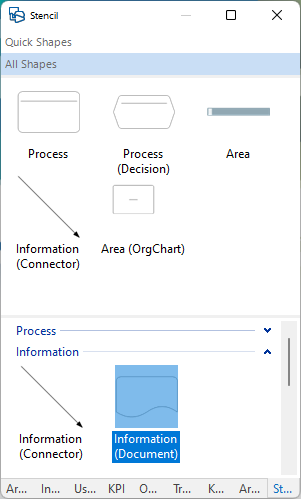
Use the Information (document) shape for this and not the Connector normally used in process graphics.

