Modeling Organigrams (Area Graphics)
Applies to: viflow (subscription | 9 | 8) | Article: 1588901 | Updated on 30.04.2024
The classic application for an area graphic is the organization chart, with which hierarchies and affiliations can be graphically displayed. Organizational charts can be displayed in an area graphic.
Modeling an Organigram
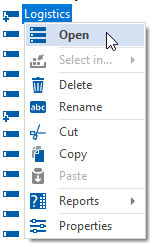
- Right-click the area to be modeled as a graphic and select Open from the context menu [
.png) ].
]. You can either click on the area in a window (e.g. Explorer, Overview) or directly in a process graphic.
 - Now add the associated areas by proceeding as described in the modeling of process graphics and in the chapter ››› Modeling areas.
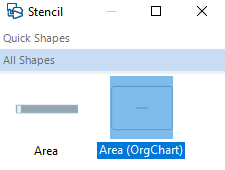
Use the Area (OrgChart) shape for this, rather than the swimlane shape (Area) typically used in process graphics.
- If necessary, add connectors or information to the graphic. The procedure corresponds to that described in the ››› Modeling information chapter.
Area Assignments in migrated Process Models
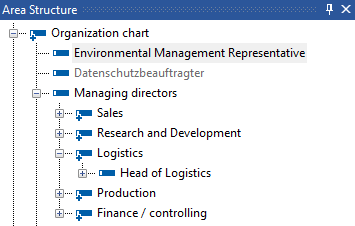
Although it was not possible to model area graphics in versions (prior to viflow 7), areas could be assigned to one another using drag & drop. These assignments are retained when migrating to an actual viflow process model and make it easier to create organizational charts. The assignments under the areas are displayed in the Area Structure window (viflow 8: Organisation window) and are marked with a [+] symbol.

Right-click on a process marked with a [+] symbol and select Open from the context menu. 

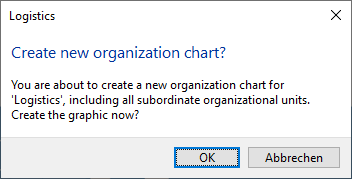
Confirm the Create new organization chart? with OK, the organization chart is created based on the existing area assignments.

